RFPMart
City Statistics
Key demographic, economic, and environmental data about our city.
-
Population
100,000
-
Median Household Income
100,000
-
Unemployment Rate
100,000
-
Average Commute Time
100,000
-
Crime Rate
100,000
-
Carbon Emissions
100,000
Population & Demographics
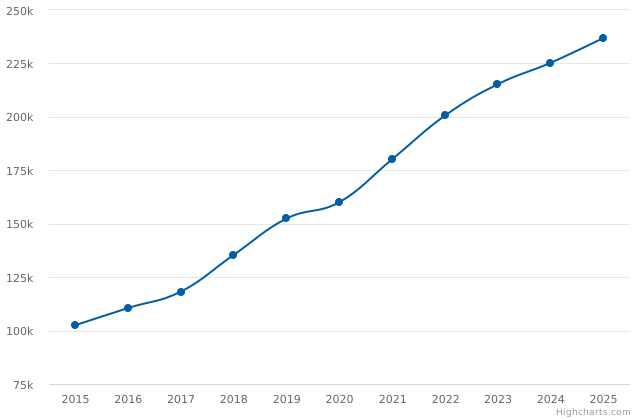
Population Growth Over Time
This chart shows how the city’s population has changed over the past decade. It highlights periods of rapid growth, stabilization, or decline and provides a baseline for planning future infrastructure and public services.
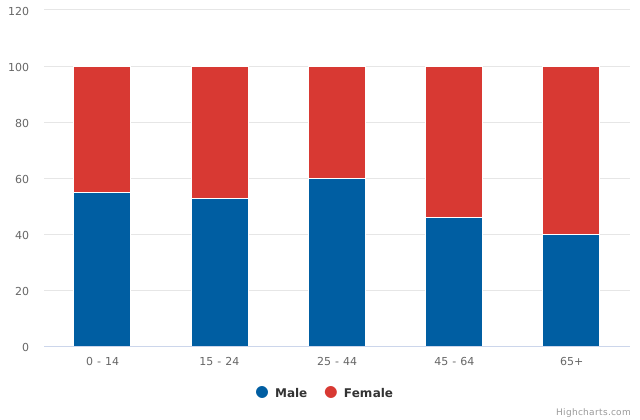
Age-Gender Distribution
This visualization breaks the population into standard age cohorts (e.g., 0–14, 15–24, 25–44, 45–64, 65+). It provides a snapshot of generational balance in the community and helps identify service needs for children, working-age adults, and seniors.
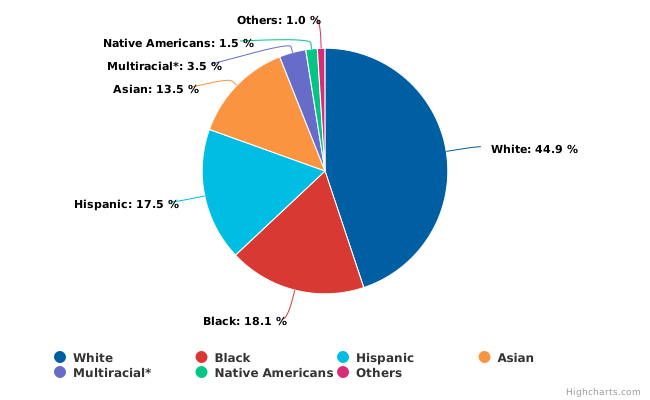
Racial and Ethnic Composition
This chart summarizes the city’s racial and ethnic composition based on census categories. This data helps guide inclusive public engagement, equitable distribution of resources, and culturally responsive community programs.
Economy & Employment
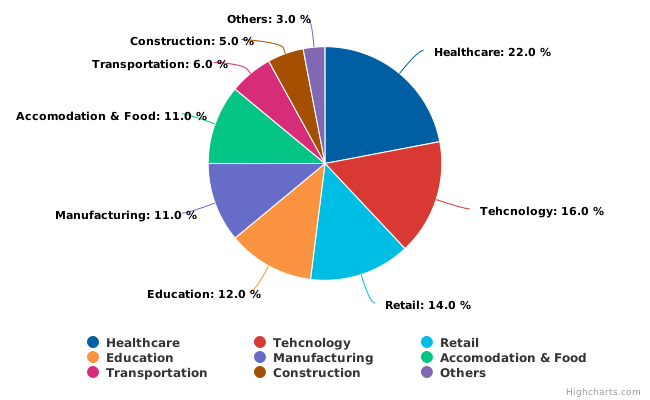
Employment by Industry Sector
This chart displays the share of total employment attributed to each major industry sector (e.g., Healthcare, Manufacturing, Retail, Education, Professional Services, Hospitality). Understanding the sector breakdown helps the city assess economic diversity and identify industries that may need targeted support or training programs.
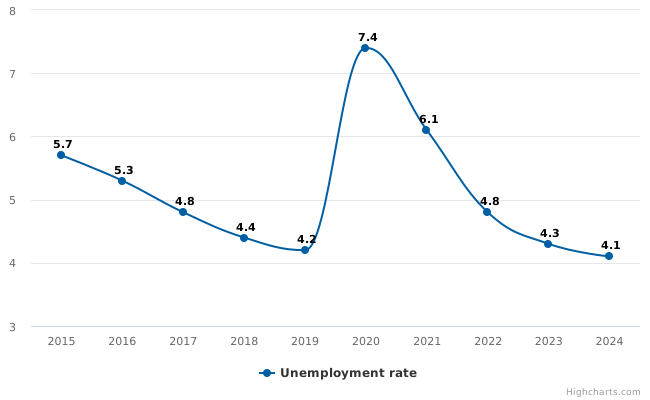
Unemployment Rate
This chart presents the unemployment rate over the past several years, highlighting shifts due to economic cycles, local initiatives, and broader regional or national conditions. It provides context for the city’s workforce stability and helps evaluate the effectiveness of employment programs.
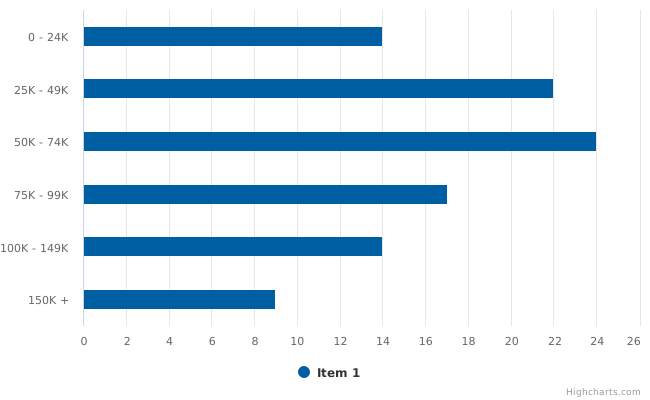
Household Income Distribution
This visualization shows the distribution of households across income ranges (e.g., under $25k, $25k–$49k, $50k–$99k, $100k+). It helps assess overall affordability, the economic diversity of residents, and the scale of need for social support programs.
Public Safety
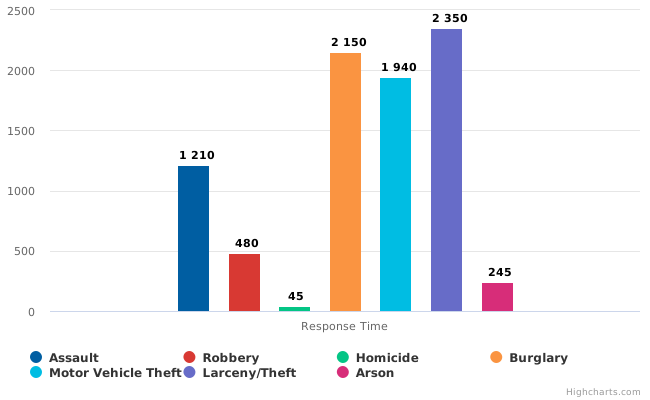
Crime Rate by Category
The chart highlights the distribution of reported crimes by category, helping residents and policymakers understand the most common public safety challenges. The majority of incidents fall under property crime, consistent with national trends.
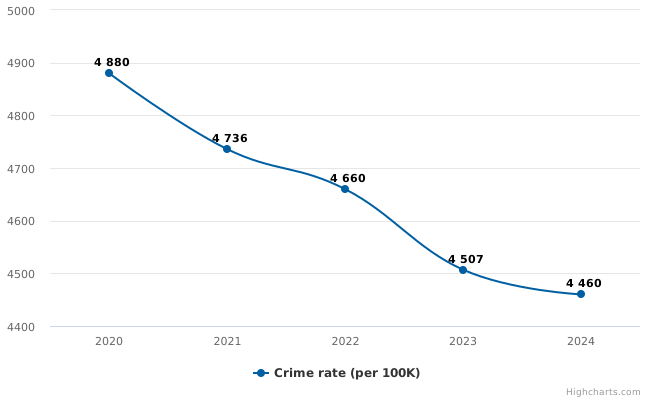
Crime Rate Trend
Crime has gradually declined over the past five years. The sustained reduction aligns with expanded community policing efforts, neighborhood programs, and investments in public lighting and surveillance infrastructure.
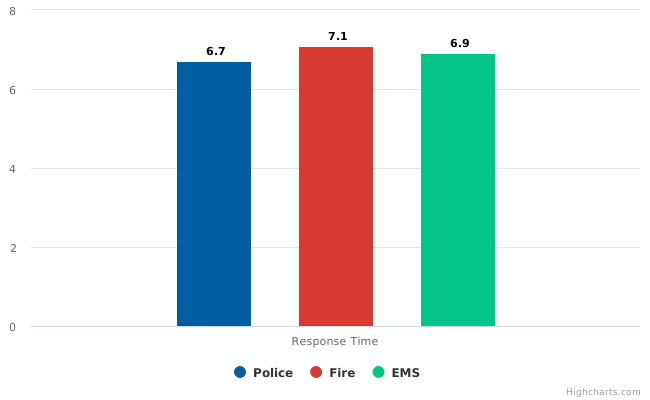
Police, Fire, and EMS Response Time
Response times remain within the city’s performance targets. Police and Fire services tend to arrive slightly faster due to station placement and dedicated dispatching, whereas EMS units serve a higher call volume.
Education
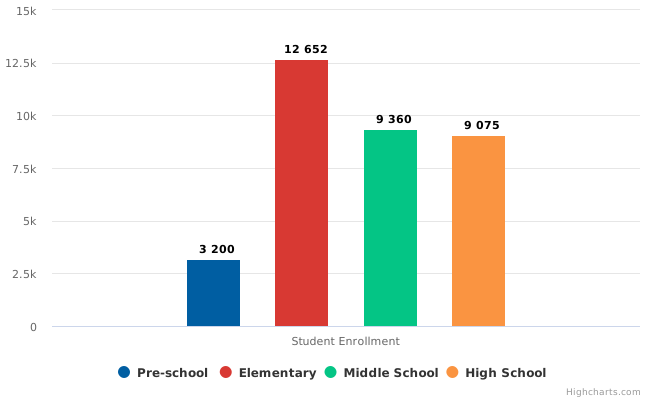
Student Enrollment by School Level
Enrollment levels help the city and school district plan for staffing, classroom space, transportation, and after-school programs. Recent trends show stable elementary enrollment and moderate increases in Pre-K participation following early childhood initiatives.
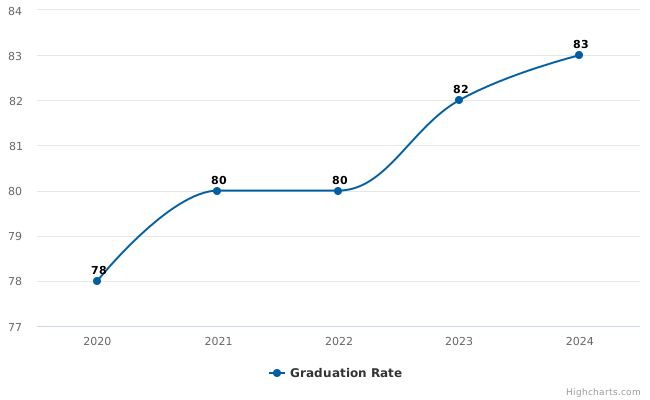
Graduation Rate Trend
Graduation rates have steadily improved over the past five years. The city attributes progress to expanded tutoring services, strengthened career and technical programs, and increased collaboration with community organizations.
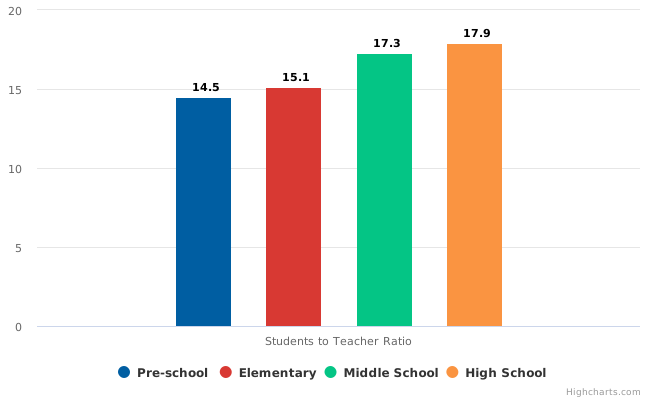
Student–Teacher Ratio
Lower student–teacher ratios are linked to improved academic outcomes. While elementary schools are within recommended ranges, middle and high schools remain slightly higher due to subject specialization and staffing constraints.